
Once your network stops being a single flat LAN with a few friendly devices, guessing becomes a very poor way to debug anything. Between VLANs, containers, DNS filtering, self-hosted services, NAS traffic, random IoT conversations, and a few machines that always seem to be doing something in the background, the problem is rarely as simple as “the Internet is slow.”
That’s where Linux is still hard to beat. A few small command-line tools can tell you more about an active network than many polished dashboards, especially when the failure isn’t big enough to ruin everything, but annoying enough to reappear. These are the Linux monitoring tools that help me discover what’s really happening on my network, rather than relying on router summaries, half-helpful web dashboards, or the old “Have you tried rebooting?” until things work out.
ip shows what the machine really knows
The first check before blaming the wrong layer
He ip The command is where I start most network checks, especially when the problem involves containers, VLANbridges or a host that has more than one exit from the network. It shows the addresses a machine actually has, the routes it actually knows, and the status of the links the kernel is working on. This sounds basic only if you haven’t spent enough time debugging a service that seemed to be down while the real failure was a missing route, a stale address, or traffic going out through the wrong interface.
The command I use most frequently is: ip addr && ip route
That gives me the interface state and the routing table in a single view. If an interface is missing the address it expected, the fault is less than that of the application. If the default route points somewhere strange, traffic is already taking the wrong path before any higher-level services intervene. If a bridge exists, but not the expected path, the container runtime usually doesn’t do what I thought it was doing.

Ping shows where the break started
A compelling test that still saves time
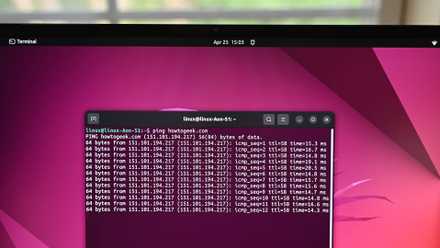
Ping is not a very complex tool, which is why it is still useful. Answer a specific question before wasting time with a broader question: can this host communicate with that host? It doesn’t tell me if the DNS is healthy, if the web application is working, if TLS is fineor whether a service is linked correctly. It tells me if there is basic accessibility, and that is still the right place to start much more often than people admit.

I usually use it as a small ladder. First I ping the gateway, then another localhost, then an external IP address, then a domain name. That order quickly separates a link problem from a routing problem and also prevents me from turning every interruption into a long story about the ISP.

If the gateway is not responding, I look at the link-local, interface, VLAN, or access point. If the gateway responds, but an external IP does not, the fault has moved to routing, NAT, or upstream. If the external IP responds, but the domain name does not, DNS becomes the prime suspect.

9/10
- Brand
-
Unifi
- Range
-
1,750 square feet
- Wi-Fi bands
-
2.4/5/6GHz
- Ethernet ports
-
4 2.5G
The Unifi Dream Router 7 is a complete networking device that offers NVR capabilities, fully managed switching, an integrated firewall, VLANs, and more. With four 2.5G Ethernet ports (one with PoE+) and one 10G SFP+ port, the Unifi Dream Router 7 also features dual WAN capabilities in case you have two ISP connections. It includes a 64GB microSD card for IP camera storage, but can be upgraded for more storage if needed. With Wi-Fi 7, you can achieve a theoretical network speed of up to 5.7 Gbps when using the 10G SFP+ port, or 2.5 Gbps when using Ethernet.
ss shows what is heard and what is not.
When a service says it is running but the network disagrees
Just because a service is “active” does not mean it is accessible. The process can be active while listening only on 127.0.0.1bound to the wrong address, blocked on IPv6 when I’m testing IPv4, or hidden behind a port mapping that exists in the compose file but not on the host the way I expected. This is the reason ss is one of the most useful Linux tools for network services.

ss allows me to listen to TCP and UDP sockets, the ports they are bound to, and the processes that own them. When a panel indicates that a service is running, but the browser cannot access it, ss It tells me if the service is really listening where I need it to listen.
This was very important when I set up DNS on my NAS. Port 53 is one of those ports that can become a small battlefield. A local resolver, containerized DNS service, systemd-resolved, or another auxiliary service may already be linked to it. The container can also be listening within its own network namespace while the host remains silent at the address it planned to use.
![]()
Nmap shows the network from the outside
View a host as other hosts see it
Local controls can be misleading because they show the machine from its own point of view. A service may look fine on the host where it runs, but remain unreachable from the rest of the LAN. That’s why I like to check from another machine with nmap.
Nmap shows what is actually visible from the network. It’s useful for checking if a server is exposing only what it intended and it’s also good for reminding me how many devices have silently accumulated over time. Old phones, TV boxes, smart plugs, breadboards, printers, forgotten virtual machines, and temporary machines have a way of becoming part of the landscape without asking permission.
On my own LAN, a simple scan is usually enough to compare beliefs with facts. If I believe my NAS should expose only SSH, DNS, and a web panel, nmap tells me whether that belief survives contact with the network. If additional ports appear, I know there is something to explain. Sometimes it is harmless (for example, I have XRDP). Sometimes it’s an old service that should have closed months ago.

Tcpdump shows what is actually crossing the wire
When the records are too long to tell the whole story
tcpdump It’s not the most comfortable tool to look at, but it is one of the most useful tools that Linux has to offer for troubleshooting serious network problems. It allows me to observe traffic at the interface level, meaning I can see if DNS queries are leaving, if responses are coming back, if a client is retrying the same failed connection, or if traffic is hitting an interface it should never have touched.

For DNS, it is especially useful. If a client says DNS is down, I can look at the DNS server and see if the query comes through. If the query arrives but no response comes out, the problem is the server or its upstream path. If the query never arrives, the problem is between the client and the server. If the answer comes out, but the client never sees it, the return path is where I should look.
Bmon helps detect bandwidth hogs
A live view of the link when the issue loads.
Not all network problems are an outage, some problems are related to bandwidth and load. A backup task is triggered, a phone starts syncing, a torrent client gets too excited, a container pulls images at the wrong time, or a service starts sending traffic over a segment that should have been quiet.

Bmon gives me a live view of the bandwidth used by the interface. It’s simple enough to keep open during testing, but useful enough to show when the form of the problem is not packet loss, routing, or DNS, but simply traffic pressure. Sometimes I don’t need a full panel to answer the first question. I need to know which link is busy.
Less guesswork and tighter controls
These tools gave me a better order of checks. I start with what the machine knows, then test reachability, then check listening sockets, then scan from another host, then inspect packets, then watch payload, then read logs for failures.
That order prevents me from going directly to the more complex explanation. Linux networks may look messy from the outside, but most failures leave marks if you look at the right level. Together, these tools make my network easier to read. They don’t simplify it or eliminate the usual clutter that comes with containers, VLANs, DNS, and self-hosted services. They made the mess less hidden, which is often the difference between fixing the bug and restarting things until the bug gets bored enough to leave.